

A national figure gives you context. Your guest count, location and written quotes decide the budget.
The average US wedding held in 2025 cost about $34,000, while the median was $24,000. Those figures come from The Knot's 2026 Real Weddings Study, which surveyed 10,474 US couples who married in 2025.
The median is the more useful reference for a typical couple. Half of the weddings in that study cost no more than $24,000. The average sits higher because a smaller group of expensive weddings pulls it upward.
What is the average wedding cost in 2026?
There is no single 2026 figure that describes every US wedding. The most useful current reports measure different groups:
| Report | What it measured | Headline figure | Sample |
|---|---|---|---|
| The Knot 2026 study | Final spending by couples married in 2025 | $34,000 average, $24,000 median | 10,474 couples |
| Zola 2026 First Look | Expected cost for couples getting married in 2026 | $36,000 average planned cost | More than 11,500 |
| The Knot guest-count bands | Final spending grouped by number of guests | $17,100 to $43,300 across three bands | Same 2025 study |
Zola's 2026 First Look report describes plans for weddings still being organised. The Knot describes completed weddings. The two averages are close, but they are not interchangeable.
The report year and wedding year are different
The Knot published its 2026 report from weddings held in 2025. Zola surveyed couples planning weddings for 2026. One is retrospective spending and the other is planned spending.
Mean, median and the wedding you can afford
The mean adds every reported cost and divides by the number of weddings. The median is the middle wedding after those costs are put in order. When a smaller number of celebrations cost far more than the rest, the mean rises faster than the median.
The Knot's distribution makes that gap concrete:
- 25% of couples spent about $12,000 or less.
- The middle 50% spent between $12,000 and $41,000.
- 25% spent more than $41,000.
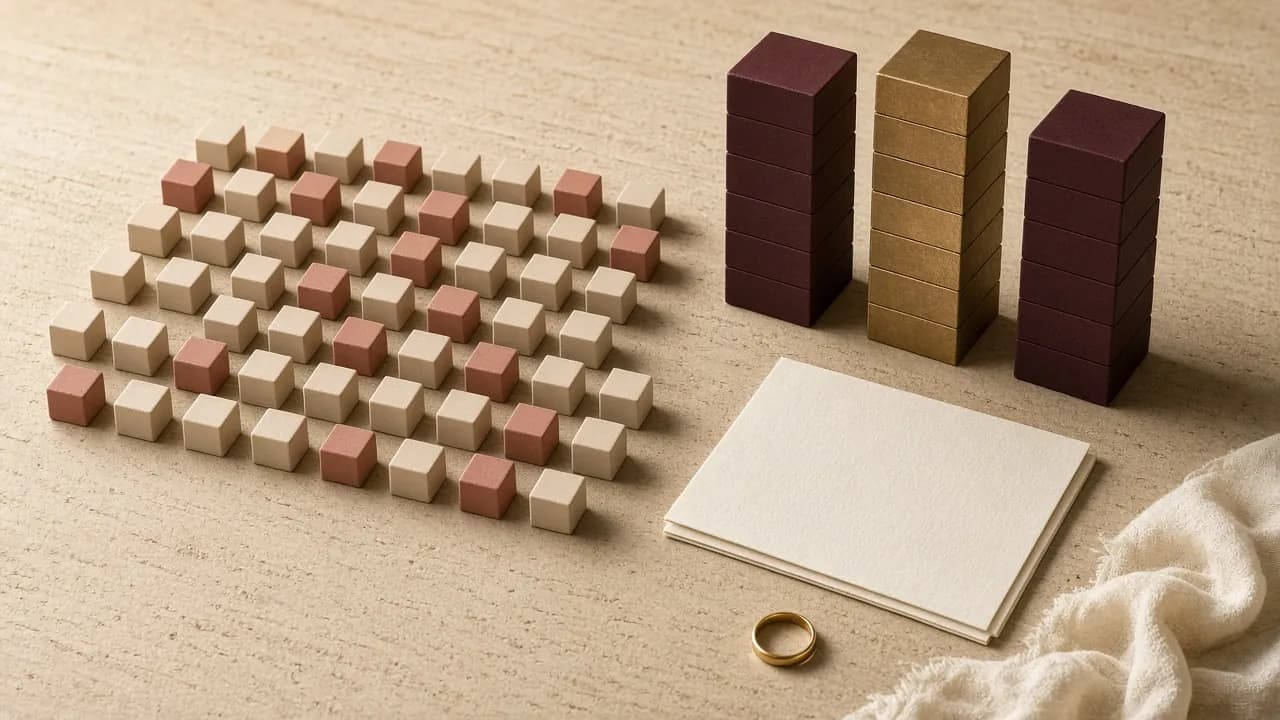
A few high-cost weddings can lift the average while the middle wedding remains lower.
Neither national figure needs to become your budget. Set a ceiling from savings and confirmed contributions, compare it with the $24,000 median for context, then replace national estimates with local quotes.
Where the average wedding budget goes
The Knot's category breakdown, updated in June 2026, puts venue and rentals at 29% and catering, cake and drinks at 24%. Together they account for more than half of reported spending.
The table below translates the published shares into a $24,000 example, the study median. It is arithmetic, not a claim that the median couple spent exactly this amount in each category.
| Category | Reported share | $24,000 example |
|---|---|---|
| Venue and rentals | 29% | $6,960 |
| Catering, cake and drinks | 24% | $5,760 |
| Photography and video | 10% | $2,400 |
| Flowers and decor | 9% | $2,160 |
| Music | 6% | $1,440 |
| Attire and beauty | 6% | $1,440 |
| Wedding rings | 5% | $1,200 |
| Wedding planner | 4% | $960 |
| Guest entertainment | 3% | $720 |
| Transportation | 2% | $480 |
| Stationery | 1% | $240 |
| Officiant | 1% | $240 |
| Total | 100% | $24,000 |
The source's summary lists the planner line at 5%, while its detailed planner section uses 4%. We use the detailed 4% figure so the example totals 100%. That small inconsistency is another reason to treat national shares as a map, not a contract.
What the category table does not include
The published breakdown places the engagement ring, rehearsal dinner, wedding-party clothing and beauty, honeymoon and some gifts outside the core budget. Your own spreadsheet needs a written scope before you compare it with any national number.
It also describes what couples spent, not what each category should receive. A restaurant wedding may put more into food and less into rentals. A family-home wedding may remove a venue fee and add power, toilets, transport or weather cover.
How guest count changes the total
The Knot reports three national averages by guest-count band:
| Guest count | Average final cost |
|---|---|
| 1 to 50 guests | $17,100 |
| 51 to 100 | $27,200 |
| More than 100 | $43,300 |
The same study reports 117 guests and $292 per guest on average. Do not multiply $292 by your list and call that the budget. That figure divides the entire wedding cost by the headcount, including fixed costs that do not disappear when one guest declines.
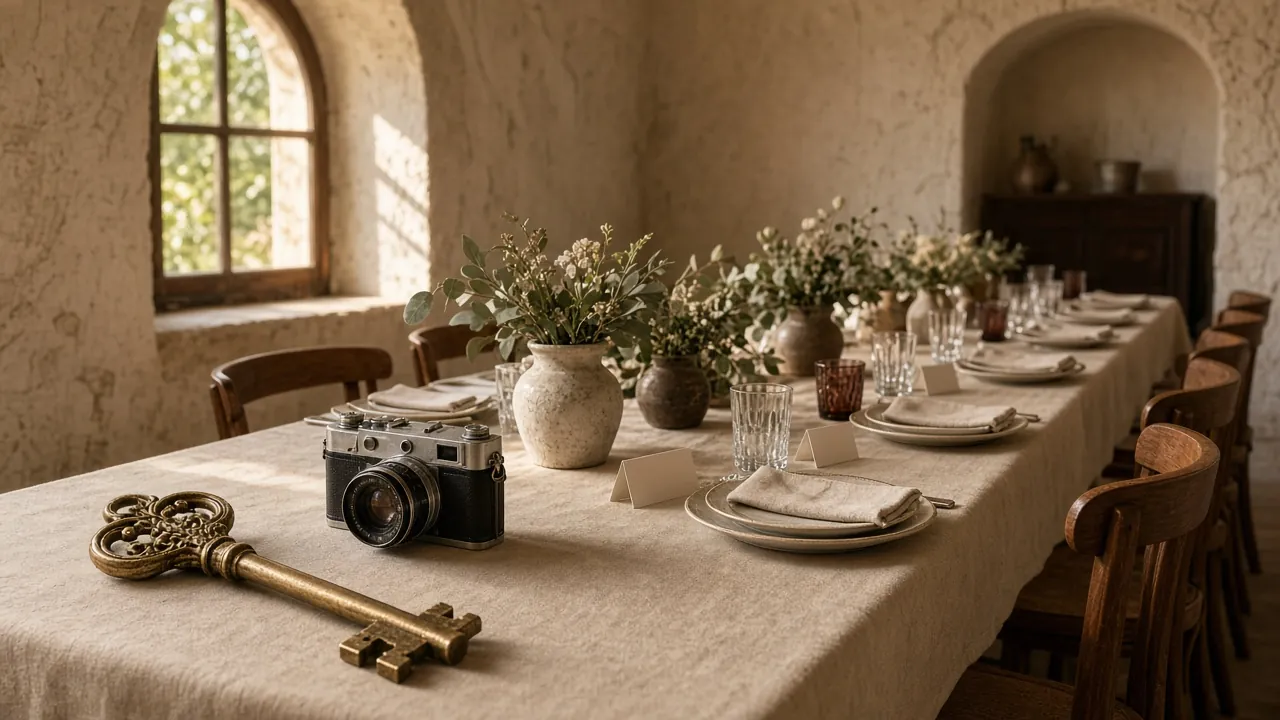
The key and camera represent mainly fixed costs. Each place setting adds food, drink, rentals and other guest-dependent costs.
Photography, attire and much of the entertainment are mainly fixed. Food, drinks, place settings, invitations and transport usually move with the list. Some costs combine both, such as a venue minimum plus a per-person package.
Use the calculator as a relationship test. Its amounts are an illustrative US model calibrated around the current national benchmark, not supplier averages or a quote.
Wedding budget estimate
| Category | Amount |
|---|---|
| Venue and rentals | $8,510 |
| Food, cake and drinks | $11,700 |
| Photography and video | $3,000 |
| Attire, beauty and rings | $3,000 |
| Flowers and decor | $2,370 |
| Music and entertainment | $2,000 |
| Planning and officiant | $1,600 |
| Stationery, transport and other | $1,670 |
Estimated total
$33,850
Per guest
$289
Illustrative 2026 US model, not a supplier quote or survey allocation. Replace every amount with written local prices. The tier control scales fixed and guest-dependent lines together.
Count invitations by household, not by guest
Guest count drives catering, but printed invitation cost usually follows households or mailing addresses. A 100-guest wedding may need far fewer than 100 invitations when many guests are couples or families.
Before pricing stationery, count:
- one invitation per household or address;
- separate invitations for adult children who live elsewhere;
- international postage and heavier envelopes;
- save-the-dates, RSVP cards, programs, menus and thank-you cards only if they are in scope.
The 1% stationery share above covers more than the invitation itself. A digital invitation can replace invitation printing, envelopes, postage and reply cards, but it does not automatically replace menus, place cards or signs. Compare the formats in the digital versus printed wedding invitation guide.
Compare one real opening
Price the invitation after you open it
Preview Le Pli on your phone, then compare the current one-time publishing price with the complete printing, envelope and postage quote for your mailing addresses.
Compare all templates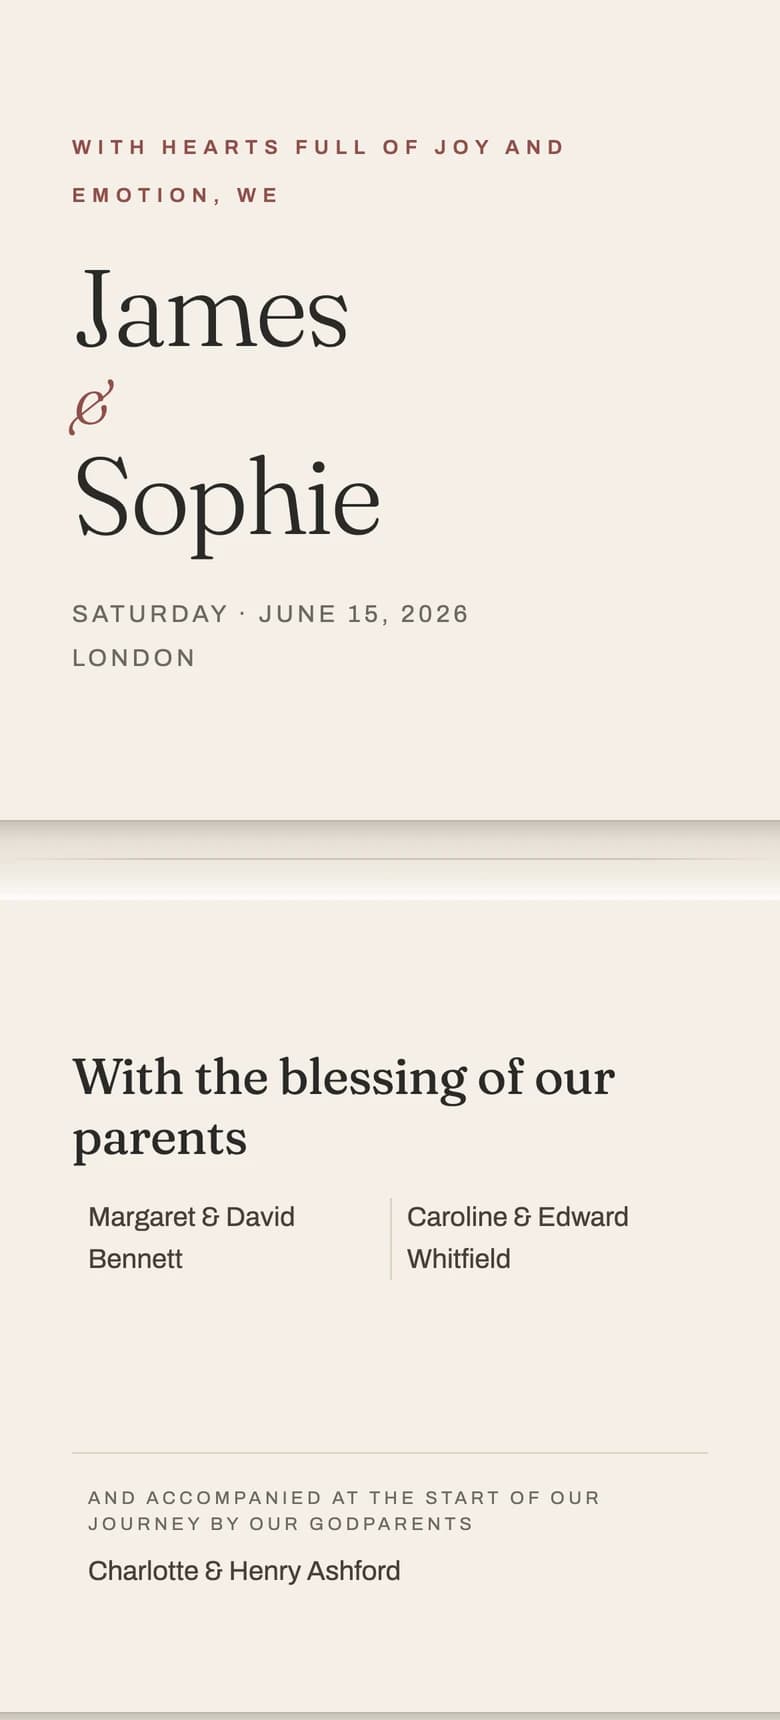

Use the national data without copying the average
First, set a ceiling from available savings, realistic monthly savings and confirmed contributions. Write down whether it includes the engagement ring, honeymoon, rehearsal dinner and extra wedding-weekend events. The realistic wedding budget guide owns that process.
Next, mark each line as fixed, per guest or mixed. Start local quotes with venue, rentals, food and drinks, which represent 53% of the current national breakdown. Keep the same date, guest count and inclusions on every quote.
Finally, replace each estimate with quoted, contracted and paid amounts. Keep a reserve for incomplete lines and use the hidden wedding costs checklist before signing. For an editable allocation model, use the UK and European wedding budget split. For the wider sequence, open the wedding budget guide.
Questions about the average wedding cost
Before you use the national figure
If it were our wedding, we would set the ceiling before looking at the $34,000 average. We would compare that ceiling with the $24,000 median, price the venue and food locally, then let the guest count change only the lines that truly move.
Set the invitation line before you book it
Review the one-time price for a digital invitation with RSVP and unlimited guests, then compare it with your complete print and postage quote.
See invitation pricing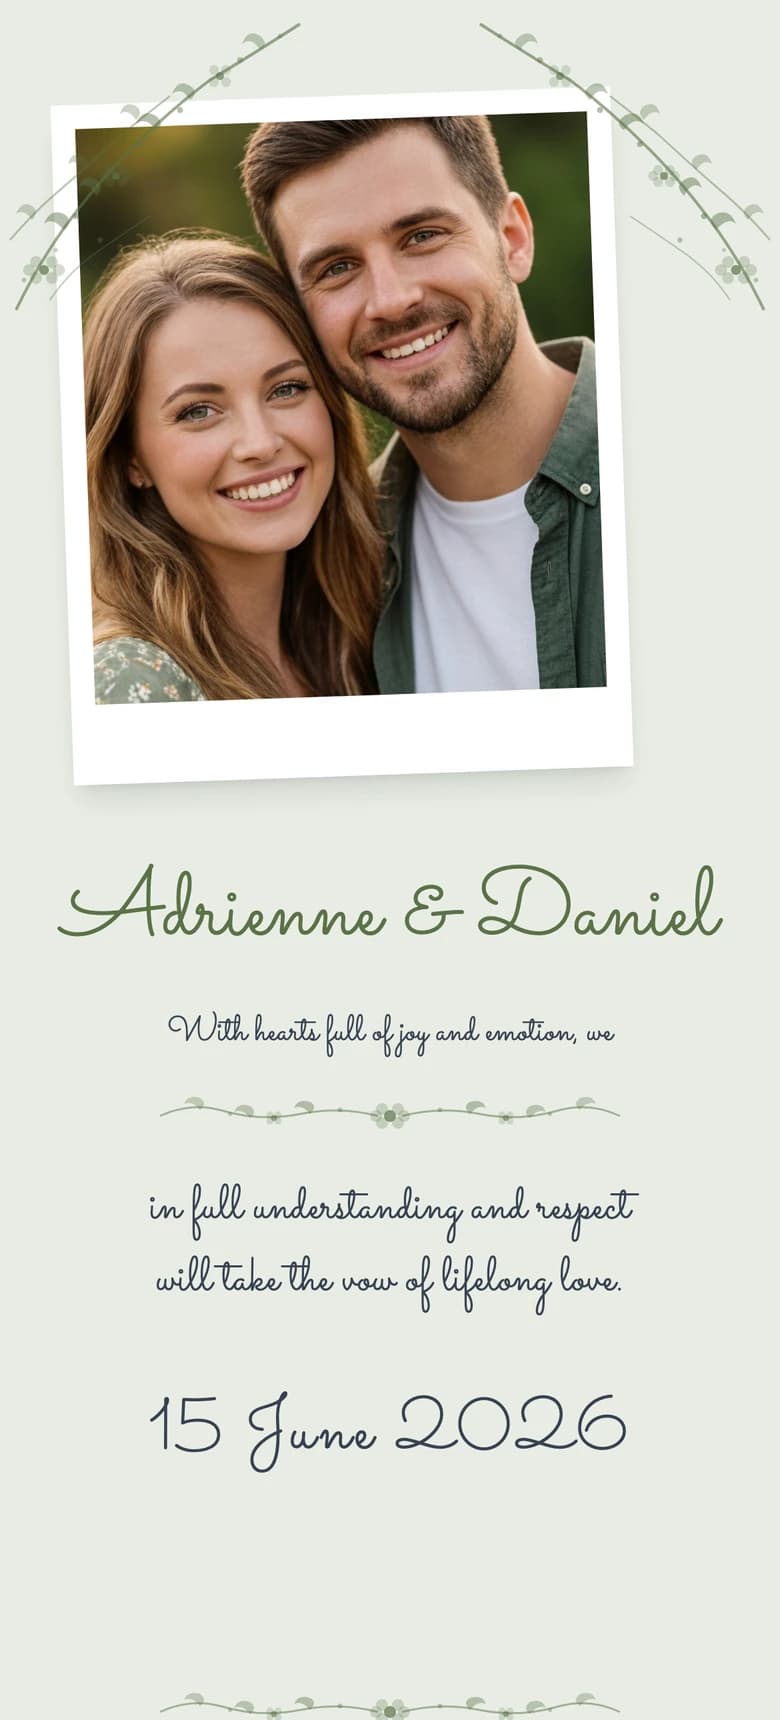
About the author
Wedding invitations, RSVP and save the date
Larisa writes the Saventify wedding guides. She covers digital invitations, save the dates, RSVP, guest lists and the templates couples actually send.
All articles by Larisa